Saturday, September 29, 2007

Monday, 10-01-07


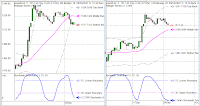
This week has an up bias off the 1507 low until late in the day Wednesday then lower toward the 45 day ma into Oct 8th. Early week support is solid at 1517 area then resistance is at 1530 to 1544. The closer to 1544 the lower the risk for a short position looking for the 1490-1480 zone.

Friday, September 28, 2007

Friday, 9-28-07


The projected low of 1499 to 1490 was supported early in price and time this week. From the 1507 low the index is due a short term sell off to the 60 minute chart moving average with a shot at the 120 min lower band then on up toward 1550 before a drop to the 45 day ma by 10-08-07 area in time. Today support looks solid at 1525 to 1522

Wednesday, September 26, 2007

Thursday, 9-27-07


Wednesday spent a lot of time pivoting around the 1523 resistance. The high of the day achieved the SR table up maximum for the day which is a rare event. Only two moves can do that, a climatic fifth wave top or the middle of a strong up move. Since we are not in position for a third wave and are in position for a topped wave from 9-10-07.

The key support for Thursday is the daily up cycle projected low level at 1522. If that level holds support and a higher high is seen it can go to 1550. Bust 1522 then the daily down cycle low at 1517 and it goes into the weekly projected low at 1499.

Tuesday, September 25, 2007

Wednesday, 9-26-07


The 1509 area did support as anticipated Tuesday and a bounce back to Wednesdays 1523 resistance is in play. Since the market did not drop into a quality low two possibilities to be alert for. One, it breaks above 1523 then 1530 and goes to near 1550 making five waves up from the 9-10 low or two, stalls at 1523 areas and drops into the weekly projected support zone of 1499 to 1490.

Monday, September 24, 2007

Tuesday, 9-25-07


Monday was a down day dropping below the daily down cycle projected low of 1518. Note the 120 chart is almost oversold and the 60 minute chart is a few hours of lower lows from being oversold. Near the close Monday options bought at the sell signal at the 1530 area could have been sold. The 1509 120 minute chart moving average is going to be solid support Tuesday if we are going to see 1605 in November. This weeks projected lows range from 1499 to 1490 and would be the maximum expected decline for the drop into a 26/27th buy signal