Saturday, August 18, 2007

Monday, 8-20-07


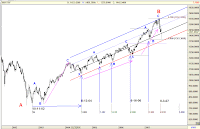
I can now count five waves down from the July 19, 2007 high and a bounce up is in progress. The low Thursday at 1370 came very close to the lower channel line; Bernanke cut the discount rate Friday and sent the market on a golf ball bounce back to 1450. If the SnP starts closing above 1500 I will be forced to rethink my analysis. The above pattern has played out to perfection so far topping at the .78 ratio 1552 target then dropping quickly to the lower channel which is exactly what I would expect the market to do if the analysis is the truth. To continue this pattern the index must remain below the thin blue 2 STDV line then later this year drop below 1363.

Thursday, August 16, 2007

Options Friday, 8-17-07


Thursday the SP-500 cash index achieved the 6.85 wave extension ratio at 1369, found expected short covering support the last 30 minutes. A bear market wave down is now indicated because of this 6.85 ratio wave. A wave two retrace will not get above the upper fibonacci price time angle with 1441 to 1463 as the wave two target zone.

Wednesday, August 15, 2007

The Dead Zone, 8-16-07


Wednesday around 2:30 PM the market fell apart dropping below the critical support at 1417. We now have short term risk down to the 1360s. From 1363 to 1336 we have a Stephen King "DEAD ZONE" below that zone the rally up from 2002 is dead. Today projected down cycle low is 1387 high 1424. Chart displays the SP-500 McOsci breadth indicator and the dead zone is marked with horizontal lines.

Tuesday, August 14, 2007

Wednesday 8-15-07


Tuesday traded below normal projected low at the 1440 area as a market anomaly worry about Money Markets accelerated the expected selling. Wednesday has an up bias toward options expiration with 1480 area as the minimum expected high. Looking at my price projections model todays low at 1426 sits on year 2007 down cycle projected high 1425 and below monthly up cycle projected low. Wednesday must close above 1425 and advance toward 1440 to turn the weekly trend up for the bounce toward Friday. If and this is very important the SP-500 closes below 1415 we have a major top indicated and a crash door opens up.

8-14-07 Intraday


SP-500 opens first hour to the 1440 area. Here is an interesting chart displaying a corrolation to the 1998 decline. Drop 12 days, sideways 7 days, rally 7 days drop sharply 21% from high to low in September.

Monday, August 13, 2007

Tuesday, 8-14-07

Tuesday should have a slow down bias toward the 1440s then advance toward the 20 day moving average near 1480.

Monday intraday


Sunday overnight futures trading pushed the futures up 17 points forcing cash buy programs at the open. i still need to see a drop to near the 1440-1430 zone before we rally to 1505-1515 areas this week.