Friday, November 30, 2007

Thanks for the comments


Thanks for love people. I started this blog to demonstrate that technical analysis works. I started at the August low and took it to the Oct high then down to 1415 near perfection all the way. I was hoping to get a dialog going, a phone call, an email something and got none of that so I am closing the blog.


In early November I was calling for the drop to 1415. OK, now here is where traders get in trouble. There are always two paths to take from a support level like 1415. One is bullish and one is bearish. If a trader has a bearish bias he will not pay any attention to the bullish path, he is reinforced to his bias by the bearish path. If this 1415 area had failed the next target was 1350 area so the trader will buy a large dollar value of puts looking forward to the 1350 path. Then the market takes the bullish path to 1490 resistance and the trader blames the analysts. I have seen this happen so many times so I know it is a fact.
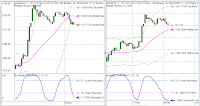
The chart displays a Fibonacci 377 day Bollinger band with support and resistance with targets if 1415 area had failed to support. The upper band should not be traded above now for many months as the market will work off the up momentum from 2006 low to 2007 high.
Good luck to all and if you wish call me, its free.
Larry


Thursday, November 29, 2007

THE END

Shutting down this blog due to no interest. No emails, no phone calls, no comments.

Best,
Larry

Wednesday, November 28, 2007

Thursday, 11-29-07


Record up day today blew away all resistance up to the weekly projected high at 1469. The favored resistance at 1444 to 1464 was slightly exceeded. The high today hit the intermediate resistance window that goes from 1462 to 1484 with longer term resistance at 1492.
That said where do we go from here? The high today achieved the Fibonacci 2.618 target. When a wave goes that far the retrace is almost always shallow. The minimum retrace would be 1457 and average 1448 then a double top at the low 1470. The weekly up bias starts to weaken between Wednesday after 14:30 to Thursday 12:30. No later than Monday the next weekly down bias begins into 12-07 or 12-10. So we see how this plays out Thursday/Friday.

Wednesday, 11-28-07


Tuesday quickly traded above the lower band putting in a short term bottom. Late today to early Thursday the weekly up bias begins to weaken. We should get another shot at the 1444 to 1454 lower end of the 1444 to 1464 resistance zone. If that holds into Friday we should drop to lower lows.

Tuesday, November 27, 2007

Tuesday, 11-27-07


After spending three days at the 1415 target level and expecting a bounce to 1444-1464 Monday opened to 1446 and simply tanked. Until a full hour trades above the 60-minute chart lower band no low can form. Market either bounce toward the moving average or continues on down toward the next target at 1350-1330.

Sunday, November 25, 2007

Monday, 11-26-07


Friday traded nothing but up and since it was a short trading day with 60-70 percent of participants at home on holiday we cannot have any faith in what happened Friday. This week does have an up cycle bias with 1444 to 1464 as resistance. If this resistance holds into early Thursday I plan on shorting it.

Thursday, November 22, 2007

Friday, 11-23-07


Friday the SnP opens at the most significant price level in decades. Notice the close Wednesday sits right on the lower band? The August 16th low close was 1411.27 the 377 day ma is at 1415.89, the .786 retrace from 1370 to 1576 is at 1414 making this 1415 to 1411 zone the dividing line between bull and bear trend. Since Friday is a short holiday trading day Monday will be the most significant day to find support in this zone or bust below it and continue on down to 1350-1330 areas.

Tuesday, November 20, 2007

Wednesday, 11-21-07


The 1419 level was achieved Tuesday and a bounce into the close occurred off that support. The week has a down bias and if 1414 is traded below this week the door is open for the 2.618 target at 1356.

The charts moving average area will be solid resistance this week.

Monday, November 19, 2007

Tuesday, 11-20-07


The SnP did make a lower low Monday increasing downside momentum. Today 1419 to 1414 is the target support and 1450 the resistance

Sunday, November 18, 2007

Monday, 11-19-07


The 60 minute chart has traded sideways for seven hours. The stochastic is advancing as price trades sideways while the 120 minute stochastic is moving sideways. Odds are the 1463 to 1465 ma area will not be traded above and a lower low will occur.

Friday, November 16, 2007

Friday, 11-16-07

The weekly projected high at 1487 was the top for the up cycle. Looking for continued bounce off yesterday 1443 low to 1460 today then on down toward at least 1415 with 1350s as a 2.618 extension. All we need to see now is take out the 11-12-07 low and I have a confirmed technical indication the rally from 2006 topped at the .786 extension 1552. Next week has a down bias until day after Thanksgiving.

Wednesday, November 14, 2007

Thursday, 11-15-07

Trading Wednesday turned into a bearish pattern day as breadth was negative enough to add to downside momentum. The weekly bias is up into this Friday however the high could be in Wednesday as the weekly down cycle projected high at 1487 was achieved. The last 30-minutes tanked the market back down to the 27 hour moving average. From here we just simply see which way it goes Thursday.

Wednesday, 11-14-07


The bottom did occur at 1439 area and a rocket ride of short covering has rallied to the 120 min chart moving average and the 60 min chart upper band. Today will have a down bias to the 60-min chart moving average. Todays high and low will be solid clues to where the market goes after options expiration games are over. Down to 1415 or higher to 1520?

Monday, November 12, 2007

Tuesday, 11-13-07


This model is getting close to a bottom for at least a bounce to the area of the moving averages at 1469-1484. First support id at 1431/26 second at 1419/15

Sunday, November 11, 2007

Monday, 11-12-07


The SnP traded a sideways wave "iv" and started down for the wave "v" the last hour Friday. The 1431 area may be the low for this wave then a bounce until late Thursday.
Short term the markets are at high risk to a major top in place at the 1552 closing high. If we do get five waves down below 1400 over the next two weeks then the top is in.

Friday, November 9, 2007

Friday, 11-09-07

Thursday saw another last 90 minute rescue, trade lower all day then get saved by the bell continues. That save by the bell has moved a full hour above the lower band so a bottom is now possible. From here the market is at decision point. If it trades above 1485 today it can still go to 1605. Drops below the lower band again it goes to 1415 and the up side is done.

Wednesday, November 7, 2007

Thursday, 11-08-07

The 1489 double bottom was negated Wednesday as the collapse of the dollar, GMs huge loss, Gold skyrocketing, oil approaching 100 dollars just hammered the markets all day and it should continue today to at least 1459 area. The drop below 1489 does open the door to the 1415 target mentioned previously. Again no low can occur until a full hour trades above the 60 minute lower band.

Tuesday, November 6, 2007

Wednesday, 11-07-07

Tuesday the last 90 minutes negated any drop below 1489 as a wave five, a double bottom has formed at 1489. Now we find out if the 1530s resistance can be overcome by 11-16-07, yes-continue on up toward 1605, no- risk down to 1415.

Tuesday, 11-06-07

A double bottom has formed at the 1490 area. That could be a wave one down within five waves to the 1415 area so we are now on major top watch. Today the two moving averages form a significant resistance zone at 1516 to 1525. For the week resistance is at 1521-1528. Any drop below 1489 is now a major bearish event, any bounce stall below 1533 is a major bearish event into options expiration 11-16-07. That give us nine days of major top watch.

Sunday, November 4, 2007

Monday, 11-05-07

Friday the 12:30 hour traded a full hour above the 60 minute chart lower band stabilizing the down trend. Monday we may see a slightly positive open then lower lows. If the lower low is below 1490 risk a drop to 1415 becomes very real. If the low is above 1490 then resistance is at 1520s. A slightly positive open then below 1490 is favored.

Thursday, November 1, 2007

Friday, 11-02-07

Thursday did drop to the 1520s as expected, spent three hours sitting on the support. The final 90 minutes it all fell apart busting the monthly up cycle projected low at 1519. Another event occurred Thursday that only happens if a wave three sell off is in progress. The daily 1.618 support level at 1516 was easily busted. You may only see a daily 1.618 level easily busted once every 10 years or so, today we saw one. The pattern can also be just a normal wave A down, B up and C is in progress because a C mimics a (3) wave in the early stages like we are at now. After we see how Friday trades a better read can be had. IF it is a wave (3) daily LONG 1516 will not be traded above until the “iii” wave is completed near 1476. Therefore monitor daily LONG Friday for clues.

If a wave (3) to 1412 is underway then daily down test at 1496 will be traded below Friday.

Notice price is solidly below the lower band on the 60 minute chart? Notice the upper and lower bands are expanding? No bottom can form until they stop expanding and a full 60 minute bar trades above the lower band.

Thursday, 11-01-07

We got the usual knee jerk reactions in both directions after the FOMC as the big institutions battled it out alright. We still have the old JOBS report drama to deal with Friday. After that is out of the way it now looks like the mid 1520s will be next Wednesdays support area. Note the 27 hour lower band and the 120 minute moving average are at 1525?

Tuesday, October 30, 2007

Wednesday, 10-31-07


Tuesdays low touched the 27 hour ma and bounced slightly. Wednesday is a news “anomaly” event day in the morning and at 2:15 PM. The projected high for the day is 1540 if the day trades normal. The FOMC policy in the past has generated sharp knee jerk reactions in both directions. After the initial knee jerks the bias turns down until 11-07 with 1515 area as support.

Monday, October 29, 2007

Tuesday, 10-30-07


Monday opened higher to the super critical 1543 area and dropped back quickly spending the remainder of the day trading in a narrow range on low volume. After the FOMC policy statement Wed weekly cycles are due to turn down bias. If that turn down can hold above the 1522 to 1516 zones on the 60/120 minute charts we should get the run at 1600 by Thanksgiving. If that support fails the top may be in at the 1576 high. I favor support holds.

Saturday, October 27, 2007

Monday, 10-29-07

Friday gapped above resistance and closed above the significant resistance at1533 closing at 1535. That has driven the stochastic to a quality overbought condition. Look for a drop to 1515 ma areas then a bounce back to the high by FOMC policy Wednesday. After FOMC I look for a week of down cycle bias.

Friday, October 26, 2007

10-26-07, Intraday

Pre market SnP futures were traded up to 1539 before the cash market open. That forced buy programs at the open thrusting the cash to 1530 area. I took profits on the SSO 200% leveraged SnP security at 1530 purchased at 1500. We look for 1.5 to 2% moves on these short term swings and take profits when achieved, average hold is 4 days.

The wave "4" pattern remains alive as long as the 50% retrace at 1533 is not traded above.

Friday, 10-26-07

First test on the first day passed the test for a typical wave “4”. Todays projected lows expanded lower from yesterdays lows of 1509/1503 to 507/1496. The daily projected highs are at 1519/1503 for Friday. Since Friday is a four day cycle day three do not look for much volatility. As long as the SnP cash is trading below 1526 a sideways trading range continues and if it continues until the FOMC then expect a drop to the 1470s.

Wednesday, October 24, 2007

Thursday, 10-25-2007

The drop to a double bottom low Wednesday has opened the door to a potential developing five waves down pattern. The bounce off the low should then stall near 1523 for wave "4" then drop into the 1470s to complete five waves down. If that does in fact happen the 1576 high is “THE HIGH” for the advance from 2002. Therefore be alert, be aware and cautious for this pattern.

Tuesday, October 23, 2007

Wednesday, 10-24-07

Tuesday did open higher as expected however buyers jumped all over the future early so we did not get the low risk long entry from 1508 to 1505. The end of day rally did achieve 1520 so we got almost everything expected so far. Now it gets a little risky Wednesday. Wednesday is one of those day when volatility may get a little crazy and if it opens up to 1528 that “could” be the high for this bounce. If it opens down first a dip of 4-5 points should lead to the run toward 1528. That should get the two charts stochastic solid overbought.

Monday, October 22, 2007

Tuesday, 10-23-07

The SnP bottomed Monday and is now up bias into at least Friday. Tuesday after an up open scalping a long if Dec futures drop to 1505 area looking for the cash to run up to the 1520-1530 zones.

Saturday, October 20, 2007

Monday, 10-22-07

The expectation of a drop into the 1520s to 1500 was realized Friday as a mini crash on the 20 year anniversary of 1987 played out. By Tuesday the market should be stabalized in rally bounce mode with the 60 minute chart ma as resistance. This entire week should be a up bias week after some open selling Monday then a quality low the first week of November is expected.

Thursday, October 18, 2007

Friday, 10-19-07


The SnP did trade in a slow sideways pattern allowing the stochastic to achieve the upper 90s. Resistance Friday will be the 120 ma at 1549 to the collapsed upper band on the 60 chart at 1551. Friday should be a up bias day then lower into the 1520s next week for a buy set up.

Thursday, 10-18-07


Wednesday the index did open to the 1550 area almost touching the moving average and dropped sharply to the area of 1525 as expected. We shorted the high and put 20 SnP futures points in the bank.
Today should be a slow sideways day with a slight down bias allowing the stochastic to reach overbought by the close Friday. Next week I look for another sharp drop into the 23/24th. We may see a test of the low made on 9-25 by the 23rd.

Tuesday, October 16, 2007

Wednesday, 10-17-07

The 60 and 120 minute charts are almost exactly aligned. A bounce to the moving averages is expected today then lower to 1515-1500 areas.

Monday, October 15, 2007

Tuesday, 10-16-07

This is going to be an interesting market the next two days. We finally get a quality low at 15:30 and the ma is all we should get out of it as cycles are turning toward the downside late today. It would be a major surprise if the market can trade and close above 1558 today, odds are it stalls there and begins a two week correction toward 1500.

Sunday, October 14, 2007

Monday, 10-15-07


The sharp drop Thursday is a solid indication the move up from August is a completed wave. Late Monday to Early Tuesday is a cycle turn time zone with cash index 1567 to 1570 as the projected high. The weekly up cycle projected high is at 1584 and since wave "c" of C is an extended wave a new high for the move is not unusual and if we do get the cash to 1584 areas the next leg down will drop to 1500 very fast. There is a huge call open interest at 1525 so expect a drop to that level before Thursday. If support fails at 1515-1500 odds increase the AB top for the four year cycle has also topped. The 1525 to 1515 area has to hold for the market to achieve the 1605-1635 favored target in November.

Thursday, October 11, 2007

Friday, 10-12-07


The SnP did top at the 1572/1574 area and dropped sharply to the 60 minute lower band. Amazing is the fact we still have not had a quality top or bottom. Today we have 1536-1533 as the significant support and 1560 as significant resistance. While not favored any top near the 200 day Bollinger band can be the top for this market and todays high popped above the band and tanked so it could be a significant top.

My analysis of the market has been and continues to be year 2000 top was the top and this top is an Elliott wave AB top that will be followed by a drop to the area 1994 traded in and it will get there quickly. You can see my analysis at this web page.
http://marketcharts.homestead.com/WAV.html

Wednesday, October 10, 2007

Thursday, 10-11-07


Thursday has an up bias with 1572/1574 as the 7th wave high target. Odds are this 7th wave target will be taken out next week however once this 1572/74 zone is achieved risk becomes higher than it has been since the August low. If the lower band at 1548 is taken out today or Friday a drop to at least 1530 should occur, that holds we can still make the run at 1600-1635. Many cycle analysts are looking for an October crash like decline from the high of next week however I am not one of them, still looking for the high in November at 1600-1635 zone.

Tuesday, October 9, 2007

Wednesday, 10-10-07


The market continues to rally extending the 9-25 low into a 7 moves pattern with 1574 as the final target level for wave 7. Maybe we can finally get a quality pattern as 1574 is achieved as both charts stochastic is in position to achieve 99 today.

Tuesday, 10-09-07


Monday trading was very slow due to the holiday so today will be more revealing. Recall a cycle low was due 10-08/09 so today if we can get the 120 minute stochastic near zero and not take out 1540 in the process the market is set up for a 40 point run up to 1580. If Mondays dip was all the low gets us then the market is breaking out toward the 1605 to 1635 AB cycle top. Today is a very important trading day. Below 1540 it drops to 1500 and above 1557 it goes to 1600.

Saturday, October 6, 2007

Monday, 10-08-07

Fridays knee jerk reaction to the jobs report pushed the markets higher instead of lower as expected. Monday must now trade lower than Thursdays high with 1542 to 1525 cash index the zone to trade into or else we have a serious anomaly extension. Extensions are extremely risky as they will reverse with no warning and take out the entire extension range so fast there is no escape. July 27th was a classic example of that. If the cash does drop into the 1542-1525 zone Monday it should then bottom, reverse and trade to new highs by the 15th to 17th.

Notice the two charts moving averages are at 1545 to 1540 and the lower bands are at 1532 to 1522?

Wednesday, October 3, 2007

Thursday, 10-04-07

The market did open weak and remained weak on very low volume Wednesday. The down turn should continue on down toward an alignment with the 60 minute chart and 120 minute lower bands with 1510 about as low as it will go by Monday. Once we have a quality low buying for the run at new highs is expected. Once price is trading below the 120 min average at 1532 the 1524 and 1513 bands should merge somewhere near 1515-1520 areas.

Wednesday, 10-03-07

The SnP 500 does not look like it will get much higher than 1551 if it even gets that high. The index has the look of a flat correction since the high on 9-19-07. That high was the last quality signal worthy of an option trade. The low at 1507 was not a good quality low and this high at the 1550 area is not a quality high. If this is a wave four flat then a drop back near 1515-1500 will bottom by Monday then rocket back up to a new high as flats are bullish patterns. If the index opens weak and remains weak late in the day then be alert for the drop toward 1515 by Monday and be ready to buy that drop is the strategy.

Monday, October 1, 2007

Tuesday, 10-02-07

Monday saw first of month/quarter new cash blow the index on by weekly projected high 1544. Since Monday was nothing but up Tuesday has to catch up the four day cycle with a down day to the 60/120 chart moving averages areas. By late Wednesday the cash index could be at 1558 or so making futures 1569 a high odds spot to short into for the drop into 10-08-07. The drop from a 10-03 high could be a 50-60 point drop.

Saturday, September 29, 2007

Monday, 10-01-07


This week has an up bias off the 1507 low until late in the day Wednesday then lower toward the 45 day ma into Oct 8th. Early week support is solid at 1517 area then resistance is at 1530 to 1544. The closer to 1544 the lower the risk for a short position looking for the 1490-1480 zone.

Friday, September 28, 2007

Friday, 9-28-07


The projected low of 1499 to 1490 was supported early in price and time this week. From the 1507 low the index is due a short term sell off to the 60 minute chart moving average with a shot at the 120 min lower band then on up toward 1550 before a drop to the 45 day ma by 10-08-07 area in time. Today support looks solid at 1525 to 1522

Wednesday, September 26, 2007

Thursday, 9-27-07


Wednesday spent a lot of time pivoting around the 1523 resistance. The high of the day achieved the SR table up maximum for the day which is a rare event. Only two moves can do that, a climatic fifth wave top or the middle of a strong up move. Since we are not in position for a third wave and are in position for a topped wave from 9-10-07.

The key support for Thursday is the daily up cycle projected low level at 1522. If that level holds support and a higher high is seen it can go to 1550. Bust 1522 then the daily down cycle low at 1517 and it goes into the weekly projected low at 1499.

Tuesday, September 25, 2007

Wednesday, 9-26-07


The 1509 area did support as anticipated Tuesday and a bounce back to Wednesdays 1523 resistance is in play. Since the market did not drop into a quality low two possibilities to be alert for. One, it breaks above 1523 then 1530 and goes to near 1550 making five waves up from the 9-10 low or two, stalls at 1523 areas and drops into the weekly projected support zone of 1499 to 1490.

Monday, September 24, 2007

Tuesday, 9-25-07


Monday was a down day dropping below the daily down cycle projected low of 1518. Note the 120 chart is almost oversold and the 60 minute chart is a few hours of lower lows from being oversold. Near the close Monday options bought at the sell signal at the 1530 area could have been sold. The 1509 120 minute chart moving average is going to be solid support Tuesday if we are going to see 1605 in November. This weeks projected lows range from 1499 to 1490 and would be the maximum expected decline for the drop into a 26/27th buy signal

Saturday, September 22, 2007

Monday, 9-24-07


September 19th we got a quality sell signal for a short term trade from the 1530 areas. Notice the 60 minute stochastic was walking the ceiling as the 120 minute was just below. Now both should get quality oversold for the next buy around the 26/27th.

This is our mechanical model that gives us a very good buy and sell set up. For a sell Column N must be 150 or greater, column M at 100, column F at .75 or higher, column B above 100 with the closer to 150 the better the signal. When those parameters are met a quality sell signal is in place. I like to see column B decline before taking a position however if its above 150 and the other values are met it is safe to even use an option. Once the option is up 30% take it. Column D & E values give you the up trend and down trend values. Monday first hour those values are 1514 and 1508. Once the SnP is closed the bottom of an hour below 1508 the short term trend is down until it closes an hour above column D value.

Next week 1500 to 1490 is the projected low range for the week if the market is going to 1605 by 11-23-07 as I favor it is.